Winter Forecast 2018


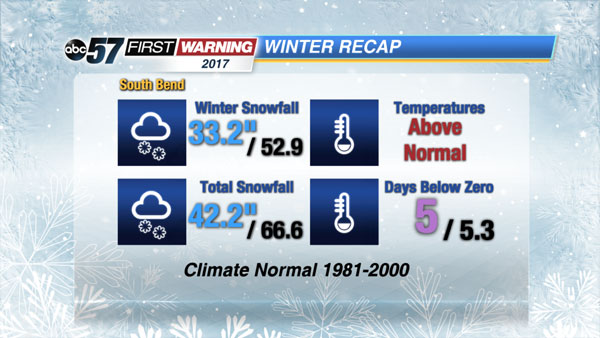
Winter 2018 will be snowier and colder than last year. That’s not exactly a bold statement since Winter 2017 was in the top third in temperature and bottom third in snowfall.
South Bend Winter Rankings
Year |
Mean Temp |
Rank |
Year |
Snowfall |
Rank |
1931-1932 |
35.3 |
1 |
1910-1911 |
35.5 |
73 |
1982-1983 |
33.8 |
2 |
1935-1936 |
35.4 |
75 |
2001-2002 |
33.6 |
3 |
1955-1956 |
34.5 |
76 |
1997-1998 |
32.9 |
4 |
1988-1989 |
34.2 |
77 |
2011-2012 |
32.2 |
5 |
*2016-2017 |
33.2 |
78 |
1920-1921 |
31.6 |
6 |
1926-1927 |
32.8 |
79 |
1918-1919 |
31.5 |
7 |
1944-1945 |
31.6 |
80 |
1991-1992 |
31.4 |
8 |
1914-1915 |
30.5 |
81 |
2015-2016 |
31.1 |
9 |
1928-1929 |
29.6 |
82 |
1930-1931 |
30.8 |
10 |
|
|
|
1999-2000 |
30.7 |
11 |
|
|
|
1953-1954 |
30.7 |
11 |
|
|
|
1952-1953 |
30.7 |
11 |
|
|
|
*2016-2017 |
30.6 |
14 |
|
|
|
The only statistic near normal was the number of nights below zero, proving that even in a mild year, you can still have a few cold snaps.
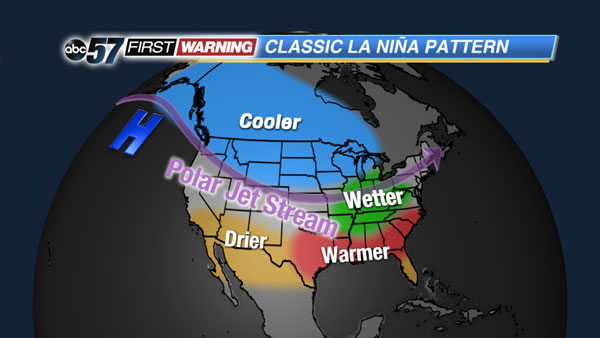
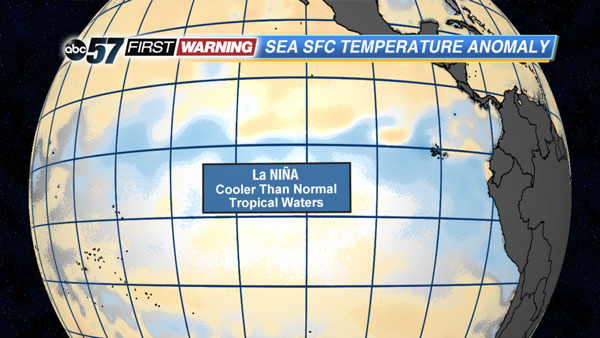
Last year had early signs of being a La Niña but really ended up being more neutral, with some La Niña characteristics. Comparing the classic La Niña pattern to Winter 2017 we can see what played out.
The classic La Niña pattern, in quick summary, is colder in the north and milder and drier in the south, with the potential for wetter (or snowier) weather in the Midwest.
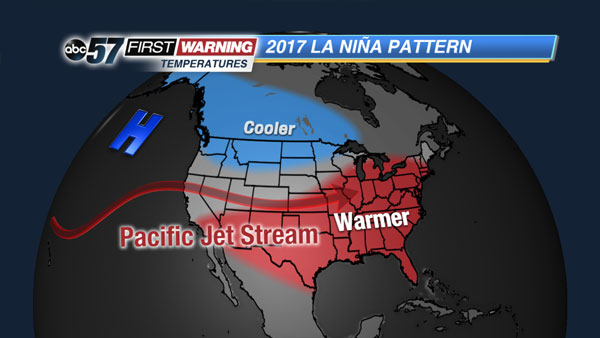
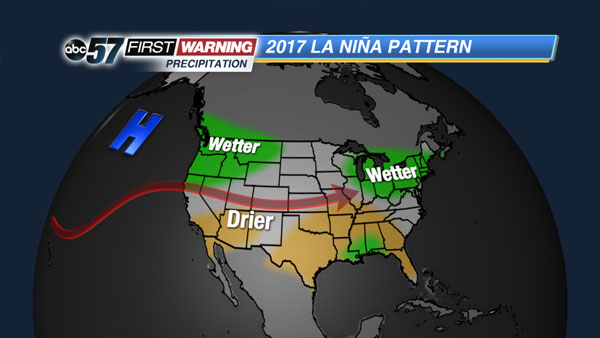
What actually happened was very little influence from the polar jet stream and a more zonal east to west pattern of the Pacific jet stream. This kept us milder but still wetter than normal.
La Niña is back again this year, the influence is already stronger and more pronounced than last year with cooler than normal temperatures developing in the tropical Pacific.
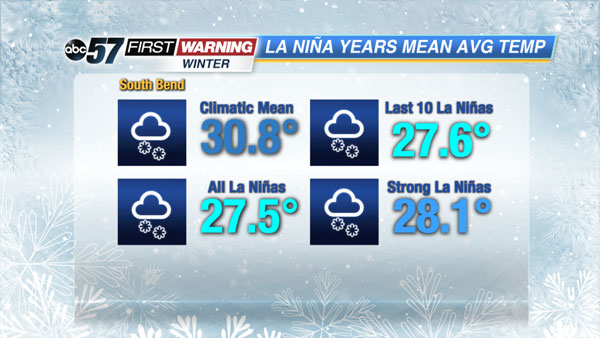
La Niña is more than just an on/off switch there are varying grades and intensities. Almost all La Niñas bring colder than normal temperatures, last year being an exception but it was very weak to even neutral.
Snowfall is where the intensity really makes a difference. Strong La Niña conditions almost always mean above normal snowfall. The trend over the last ten La Niña’s is also higher than normal, aided by our last very strong La Niña 2010-2011, when we had over 100 inches of snow in South Bend.
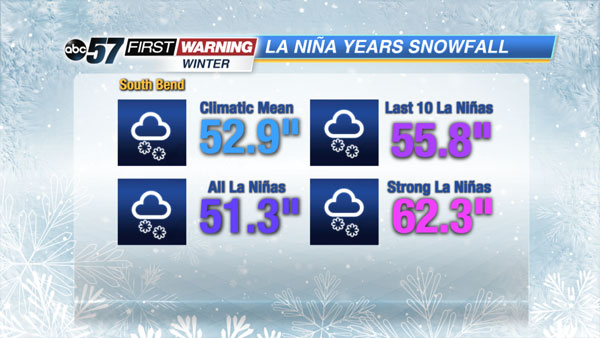
In summary not ALL La Niñas mean we’ll get a lot of snow but strong La Niñas typically do. This year does not look to be an especially strong La Niña.
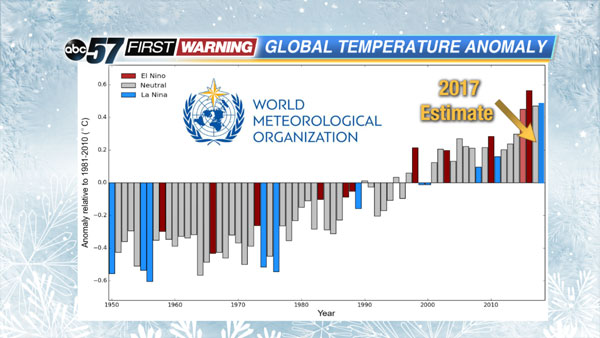
Another factor we need to continue to take into account is climate change. On a global scale El Niño is a warm cycle and La Niña is the cold cycle. That has been true since we’ve been able to keep records going back to the 1950s. However, since the year 2000 the cycles remain the same but climate overall is much warmer.
A climate update from the World Meteorological Organization shows the warming trend in global temperatures. The La Niña years are still cooler but the projection for 2017 would be the warmest La Niña year on record, warmer than most El Niño years just five to ten years ago.
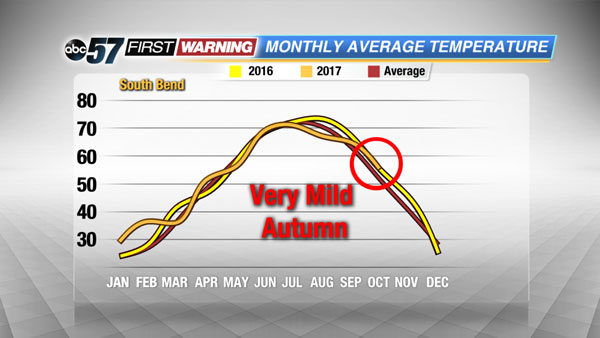
The past two years have some interesting similarities when it comes to temperature and precipitation trends.
Both years ran mostly above normal but what really stands-out is the very mild autumn. Both years saw incredibly mild Octobers that delayed the leaves changing and the onset of winter conditions.
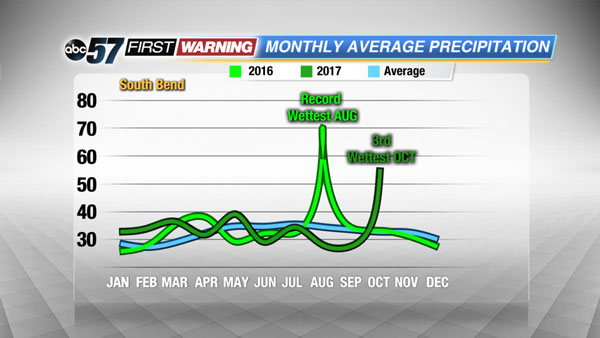
Both years also saw wetter than normal springs, below normal summer precip until record or near record setting rainfall in the second half of the year.
Just because two years seem to be similar doesn’t always predict the same outcome but we’ll see how long they continue to stay similar.
The first inch of snow in South Bend typically falls in November. Over the past ten years that average date is November 22nd. As of October 15th, we still have not had any measurable snowfall in South Bend.
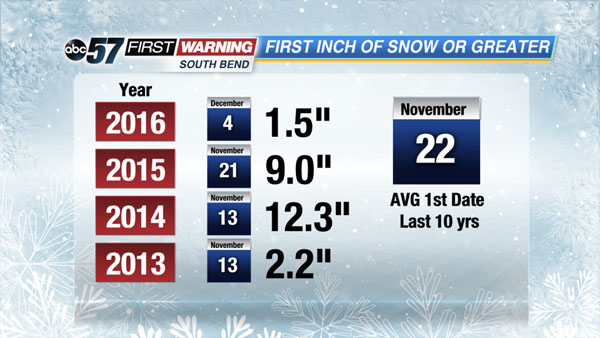
If this year mirrors last year our first inch of snow may not be until December.
There are other factors that impact the winter season.
- Early Season Snowpack
- Arctic Sea Ice
- Polar Vortex
- Other Climate Circulations
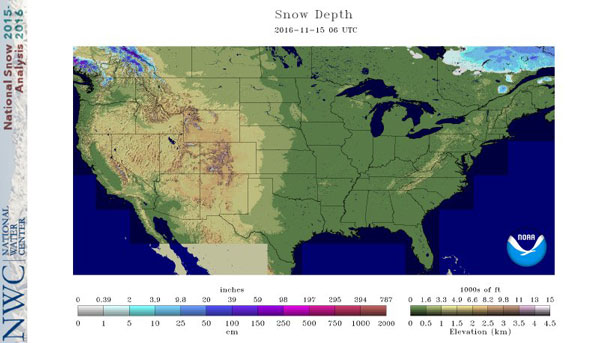
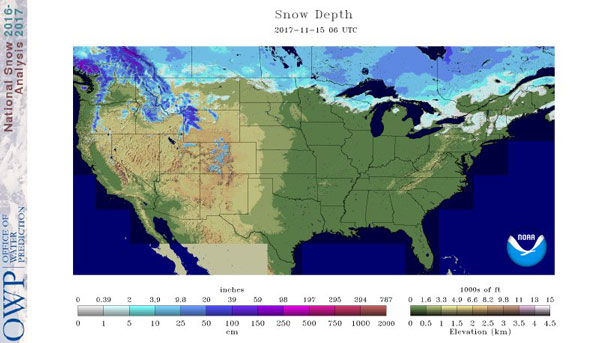
Let’s look at snowpack across Canada, the northern U.S. and Rockies. It’s much higher than 2016. This would favor colder air moving into lower latitudes. Snow-free ground is warmer and would modify (warm) air mass as it moves southward. The cold air wouldn’t be as cold. This makes colder weather more likely.
Arctic sea ice has been one of the most alarming and consistent signals of a warming climate. This year nearly mirrored 2016 until this fall, with slightly higher amounts as of mid November.
Arctic Sea Ice Extent
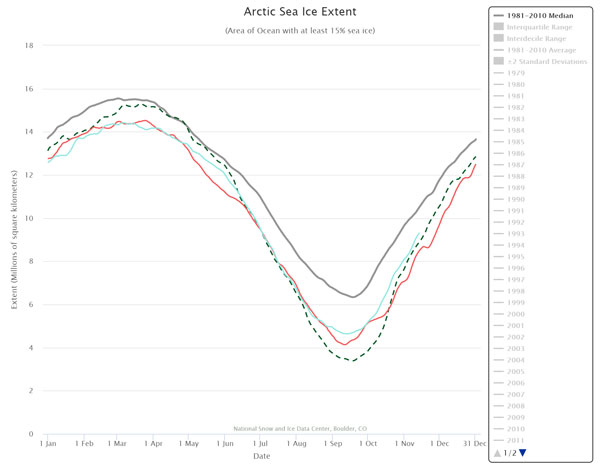
1981-2010 Median Gray, 2012 (Lowest) Green, 2016 Red, 2017 Red
The amount of sea ice can impact the Polar Vortex. The cold air circulation around the arctic. Less ice typically means a weaker vortex and a more volatile circulation that can cause wild arctic outbreaks to be more likely.
As of mid November trends show a strengthening Polar Vortex that may stabilize our weather pattern into early December. That doesn’t mean we won’t get colder or see snow but the pattern may be more predictable. You can get an in depth update here.
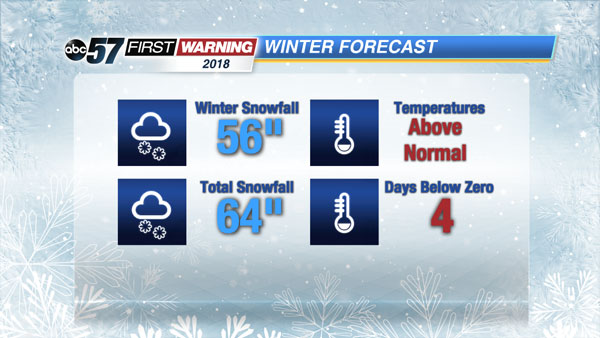
Winter Forecast 2018
So what does all this mean for this coming winter? If you’ve read this far, you know there are some factors that play for a cold and snowy winter and some that play against. A stronger La Niña bodes well for colder and likely snowier season than last year. A warming climate in general continues to decrease the likelihood of what’s considered normal snowfall in the future.
So we try to balance out these influences and all other other factors. It’s likely we’ll see near to above normal snowfall for the winter season and snow year. Temperatures may also trend near or just above normal.
I would plan on a higher frequency of snowfall this year and more significant lake effect, that was almost non-existent last year. However we’re not predicting a harsh winter, just one the would be considered typical for Michiana.
I wouldn’t be doing my job as a scientist if I didn’t inform you of the caveats of a long range forecast. This does not guarantee we will or won’t see the BIG snow storm. Those are not possible to see months (or even weeks) out. We’re talking general probability for a season.
One big storm could make-or-break this forecast and we only have good confidence through mid winter. When climate forecasts are made, it’s hard to see any trend for late January or February. Last year was cold to start January, then we stayed mild the rest of the winter.
I’ll leave you with what I tell students during Project Blizzard. “Be proud of living where we actually get snow and a true winter, most of the country isn’t so lucky”